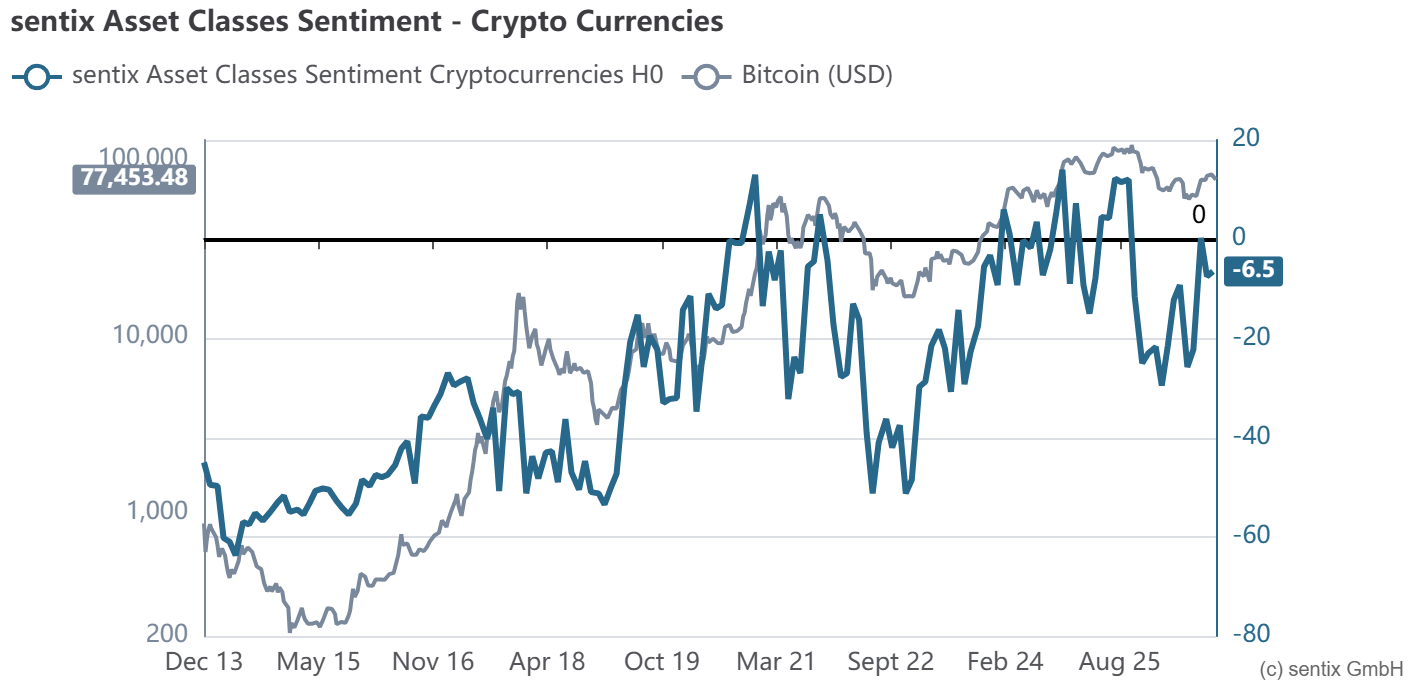
Current chart
Updated weekly by sentix.
What it measures
Once a month, investors tell sentix how strong their current preference is for each of seven asset classes – including cryptocurrencies. There is no fixed time horizon: methodically, the indicator is a mix of Sentiment and Strategic Bias.
Rising preferences signal a willingness to buy, which tends to turn into transactions and price moves with a time lag. That is why the indicator often leads the market.
How to read it
| Reading | What it often means |
|---|
| Rising preference | Growing willingness to buy – often ahead of rising crypto prices. |
| Falling preference | Growing willingness to sell – often ahead of weaker prices. |
| Extreme readings | As with all directional indicators with a fixed range, extremes raise the odds of a trend reversal. The indicator then turns contrarian. |
Part of a family: sentix also measures investor preferences for credits, emerging market equities and bonds, real estate and IPOs – useful for comparing crypto with other asset classes.
Weekly Bitcoin view