Indicator · Risk
Bitcoin Overconfidence Index
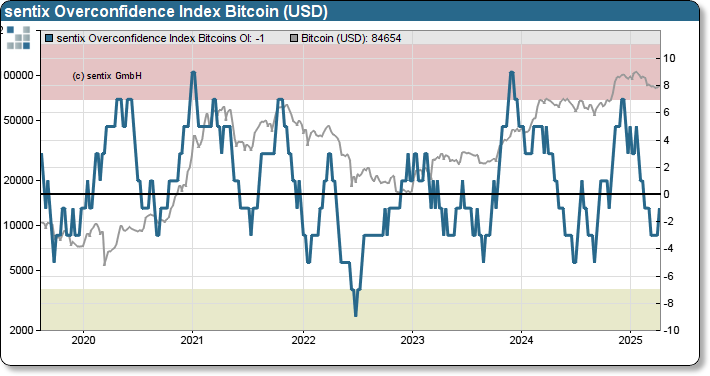
Has a winning streak made investors careless? The Overconfidence Index shows when Bitcoin's price action is likely to be seen as a sure trend.
WeeklyPrice-basedRange −13 to +13
Updated weekly by sentix.
Unlike the other sentix indicators, the Overconfidence Index is not based on the survey. It is calculated from the Bitcoin price: how often has it risen or fallen week over week in the recent past? Only the direction counts, not the size of the move.
Think of a coin toss: if heads comes up conspicuously often, players start to doubt that the coin is fair. In markets, a long run of up (or down) weeks makes investors believe in a trend. The market seems easy to forecast – and investors tend to stretch their risk budgets.
| Reading | What it often means |
|---|---|
| Above +7 | Investors probably perceive a strong uptrend. High risk of overconfidence and carelessness – consider scaling back exposure. |
| −7 to +7 | Normal range. No strong trend perception. |
| Below −7 | A one-sided downtrend. Overconfidence on the bear side – the risk of a counter-move rises. |
The higher investors are positioned, the greater the potential for a move against the trend. That is why the index works best together with positioning data.
Together with the Time Differential: if both show very high values, short-term euphoria is out of line with investors' own convictions.
More on the methodology: sentix indicator compendium
What does the current reading mean? The sentix Bitcoin report explains it – free, every Sunday.
Subscribe for free