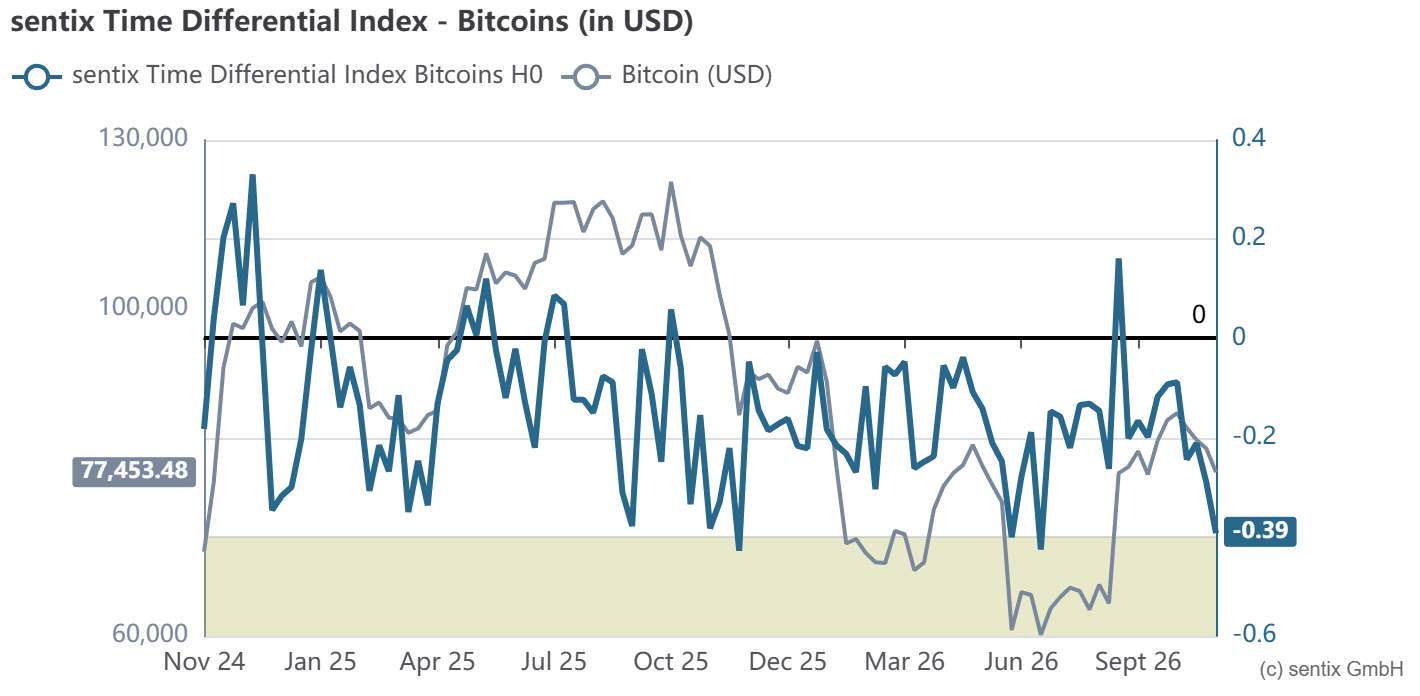
Current chart
Updated weekly by sentix.
What it measures
The index is calculated as Sentiment minus Strategic Bias. The Sentiment is dominated by emotions, the Strategic Bias by investors' longer-term perception of value.
If the two point in opposite directions, investors act against their own convictions. Behavioral finance calls this “myopic loss aversion”: investors who keep very short mental accounts are driven out of positions whose long-term potential they still believe in.
How to read it
| Reading | What it often means |
|---|
| Extremely low | Short-term fear despite solid conviction. Usually a good opportunity to enter. |
| Around zero | Emotions and convictions are in line – no signal. |
| Extremely high | Short-term euphoria not backed by conviction. A stress factor, often followed by weakness. |
Thresholds differ from market to market. Rule of thumb: readings about 1.5 standard deviations away from the long-term average often provide a usable signal.
A strong combination
Combine it with the Overconfidence Index: if both show very high values, investors are too euphoric relative to their own convictions – the market tends towards weakness.