Indicator · 1-month horizon
Bitcoin Sentiment
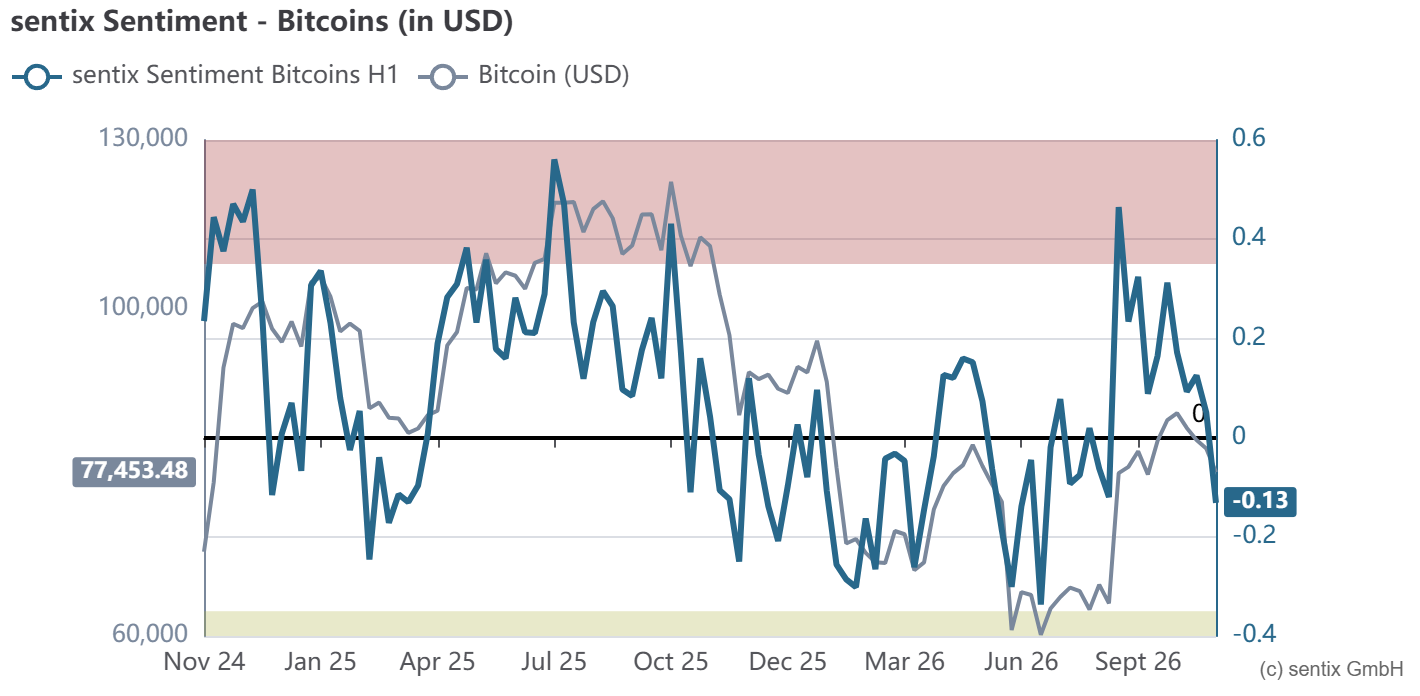
Greed or fear? The sentix Bitcoin Sentiment shows what investors expect for the next month – and where the crowd may be wrong.
WeeklySince 2017Contrarian at extremes
Updated weekly by sentix.
Every week, sentix asks private and institutional investors in the sentix Global Investor Survey whether they expect Bitcoin to rise, fall or move sideways over the next month. The index is the share of bulls minus the share of bears. It ranges from −100 (everyone bearish) to +100 (everyone bullish).
Because it captures short-term expectations, the Sentiment reflects investors' emotions, swinging between fear and greed. That is why its extremes are read against the crowd.
| Reading | What it often means |
|---|---|
| Below −35 | Extreme pessimism. Negative sentiment extremes are usually an early sign of a price recovery. |
| −35 to +35 | Normal range. On its own, the Sentiment gives little signal – check the Strategic Bias. |
| Above +35 | Extreme optimism. Often a warning sign of impending price weakness. |
| Divergence | Prices make a new high, but sentiment fails to beat its last peak. This can signal that a top is forming. |
Rule of thumb for Bitcoin: readings beyond ±35 are considered extreme. Extreme zones differ slightly from market to market – the weekly report puts the current reading into context.
Longer-term turning points often appear when Sentiment and Strategic Bias point in opposite directions – for example short-term fear while investors' six-month conviction stays high. The Time Differential measures exactly this gap.
More on the methodology: sentix indicator compendium
What does the current reading mean? The sentix Bitcoin report explains it – free, every Sunday.
Subscribe for free